tonify-sims
| *🇬🇧 English | 🇷🇺 Русский* |
tonify-sims: three simulations of a direct music economy
Payout mechanisms, social-graph spread, and treasury survival for a direct listener-to-artist music economy on Telegram/TON rails — deterministic, red-teamed, byte-reproducible.


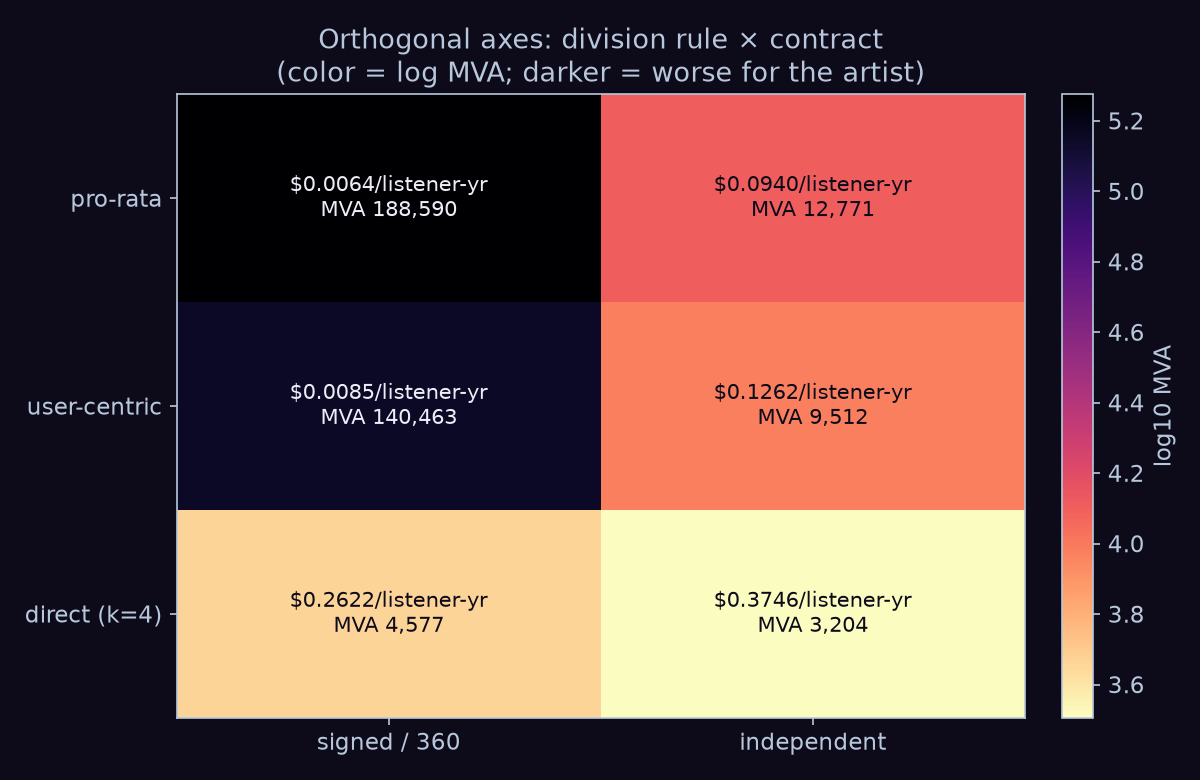
The hero figure: minimum viable audience (MVA) across the full {payout rule × contract} matrix — analytic matrix, user-centric row from a Monte-Carlo wallet model (200,000 listeners, seed 42). Darker = worse for the artist; each cell shows $/listener-year and the audience needed for $100/month.
Your favourite artist needs 188,590 listeners to earn $100 a month under a signed pro-rata streaming contract — or, on the direct rail at k=4 donations a year, between 3,204 listeners (best corner of the measured ranges: $6.89 mean ticket, 1.7% superfans) and 20,161 (worst corner: $3.10 ticket, 0.6% superfans — which loses to the independent pool’s 12,771; the full ranges are the point, not either edge). This repository holds three deterministic simulations of a direct music economy on Telegram/TON rails (Tonify): sim1 prices payout mechanisms across a 200,000-artist synthetic market calibrated to three independently measured anchors; sim2 models music spreading through a synthetic Telegram-like social graph as complex contagion (a model, not Telegram data); sim3 stress-tests the treasury law “payouts never exceed inflow” against emission-funded token economies. The industry spent a decade debating the fair formula. The formula’s effect is not even a scalar — it flips sign at a listener-intensity crossover u* (fig14); at the baseline wallet it is ×1.34. The contract moves viability ×14.8, and that multiplier is arithmetic, not emergent: the contract axis is a single measured pass-through (0.0003/0.00443 = 6.772%) applied to both rows — what the matrix contributes is commensurability, the two axes placed on one MVA grid (fig7; PAPER, Addendum v0.5; sim1 SPEC §3). Every claim below carries either a source or a falsifier; a red team with the right to retract numbers reviewed each simulation, and what it retracted is documented in this README. Every parameter’s provenance is one table: SOURCES.
Glossary
The terms the figures and findings lean on, once:
| Term | Meaning |
|---|---|
| MVA | Minimum viable audience — how many listeners an artist needs for a given income (here: $100/month) under a given payout mechanism. Lower is better for the artist. |
| MRR | Monthly recurring revenue — the platform’s revenue per month. |
| MAU / DAU | Monthly / daily active users. |
| ARPPU | Average revenue per paying user. |
| rate k | Payments per superfan per year. k=4 means a devoted fan pays four times a year; a monthly subscription is k=12. |
| take rate | The share of a payment the platform keeps. |
| pro-rata | Pool division by global stream share (Spotify’s default): all subscription money in one pot, divided by total plays. |
| user-centric | Pool division per listener’s wallet (SoundCloud FPR): each subscriber’s money goes only to artists that subscriber played. |
| rightsholder | The owner of the recording rights — the artist only if independent; the label otherwise. Spotify’s “>$1000/yr” counts rightsholders, not artists. |
| signed / independent | Contract status: signed = a label sits between the pool and the artist (~6.8% pass-through); independent = the artist is the rightsholder. |
| PWYW | Pay-what-you-want pricing. |
| log scale | Axis where each step multiplies by 10 (10³ → 10⁴ → 10⁵). Used when values span orders of magnitude; equal visual steps mean equal ratios, not equal differences. |
| lognormal | A right-skewed distribution: most values small, a long tail of large ones. |
| Gini | Inequality coefficient: 0 = everyone equal, 1 = one takes all. This market validates at 0.97 by artist streams. |
| IQR | Interquartile range — the middle 50% of outcomes (25th–75th percentile). |
| SEM | Standard error of the mean — the ± band on a simulated average. |
| P_macro | Probability that a seeded cascade reaches ≥5% of the graph (a macro-cascade). |
| R_eff | Effective reproduction number of a cascade: adoptions caused per adoption. Above 1.0 the cascade grows; the product analogue is the viral K-factor. |
| complex contagion (k=2) | Adoption requires ≥2 distinct adopted neighbours (social proof) — against simple contagion (k=1), where one exposure can convert. |
| BA graph | Barabási–Albert scale-free network — the hub-heavy skeleton of the synthetic Telegram-like graph. |
sim1 — what a listener is worth: pricing the payout mechanisms
A synthetic market of 200,000 artists, calibrated to three independently measured anchors (87% of artists under 1,000 streams/year — Luminate; 2.6% of rightsholders above $1,000/year — Spotify Loud & Clear; top-0.28% holding ≈50% of streams — CMA/Last.fm; obtained: 87.0% / 2.6% / 44.5%, Gini 0.97). Full model: PAPER; numbers: RESULTS; retractions: CRITIC; every parameter’s source: SOURCES.
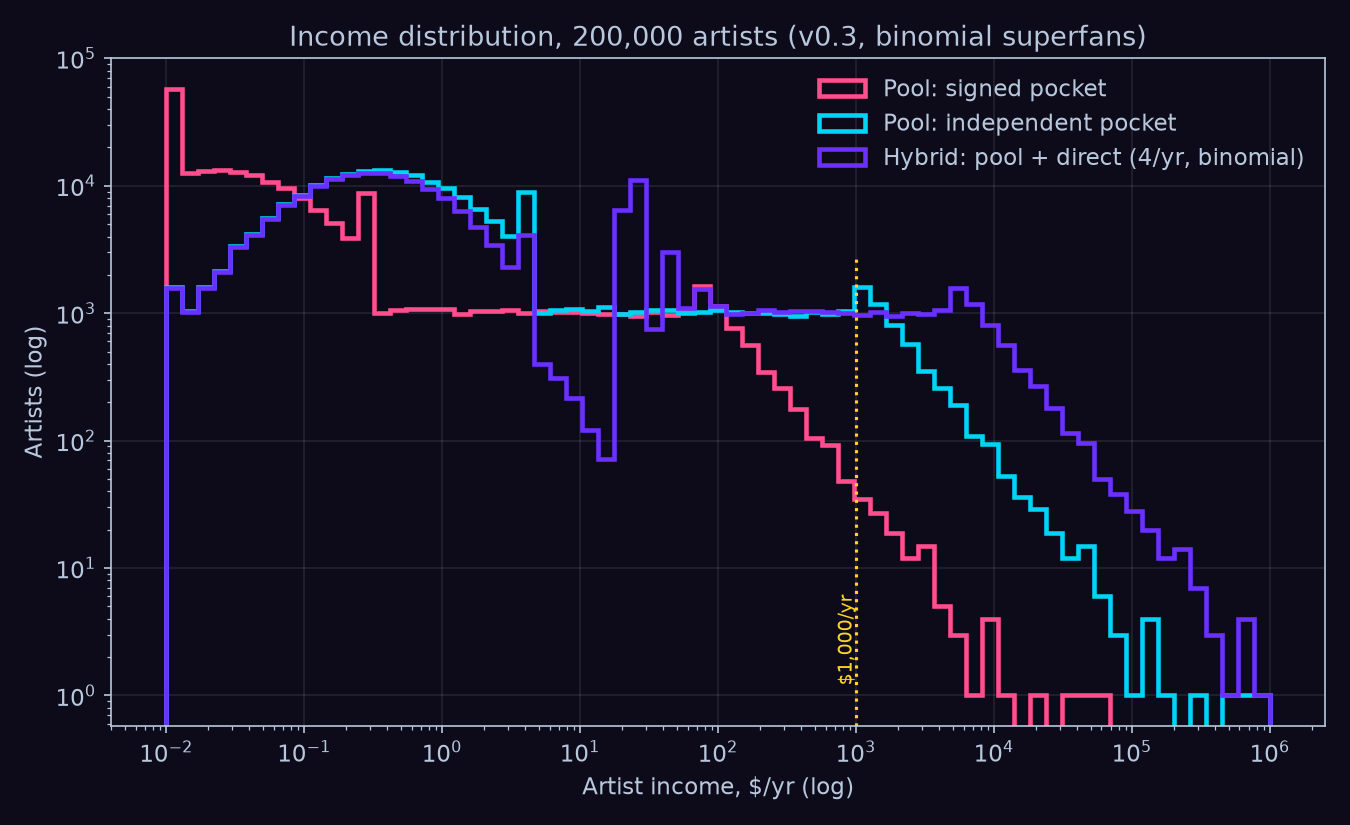
fig2 — annual income distribution over the 200,000 synthetic artists (simulation, N=200,000 artists, binomial superfan sampling; log x-axis: each step right is ×10 income). The signed-pool curve sits leftmost — a 30-listener artist has an honest ~60% chance of zero direct income.
Finding 1 — the contract outweighs the rule, and the two multipliers have different natures. The contract axis of the {rule × contract} matrix is a single empirical scalar — the pass-through 0.0003/0.00443 = 6.772% applied to both rows — so its ×14.8 is arithmetic by construction, not an emergent result; only the rule axis (×1.34 at the baseline wallet) has a Monte-Carlo origin. What the matrix contributes is commensurability: the two axes had never been placed on one MVA grid. The best World-A formula still does not survive the label pass-through: user-centric signed needs 140,463 listeners against 12,771 for pro-rata independent. The $100/month ladder: 188,590 (pro-rata signed) → 12,771 (pro-rata independent) → 3,204 (direct, at k=4, best corner); a signed-360 contract scales the artist take ×0.70 (direct MVA 3,204 → 4,577). And the rule effect itself is not a scalar — see fig14: it depends on listener intensity u and flips sign at u* ≈ 14,146 plays/yr (8,731 at PAID_SHARE 0.25; 21,371 at 0.60): above u*, user-centric is worse than pro-rata for that artist’s audience — the rule moves money toward artists of light listeners and away from artists of heavy ones (at u=20k, UC needs 18,341 vs pro-rata’s 12,771). External empirics (SoundCloud: +34% into the bottom bucket; Deezer: 2.4% of the pool shifted) independently confirm the rule effect is small against the contract effect — the qualitative conclusion survives, the point estimate does not (PAPER Addendum v0.5; sim1 SPEC §3.1–3.2).
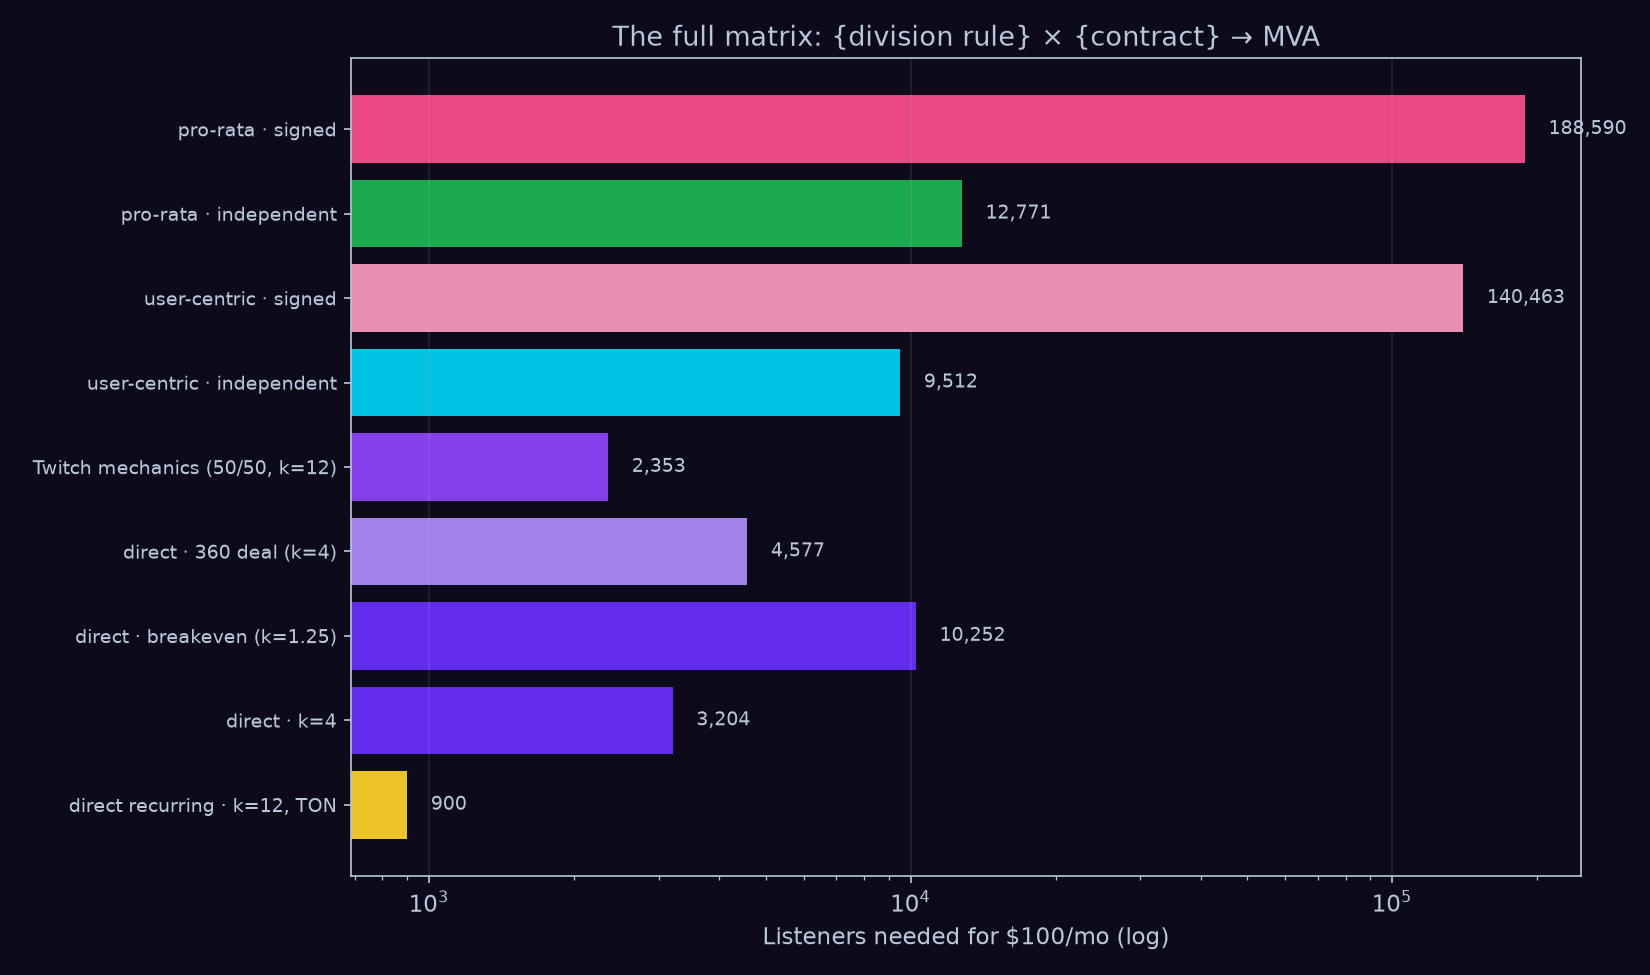
fig5 — the full World A → World B ladder (analytic; user-centric rows from the Monte-Carlo wallet model, 200,000 listeners, seed 42). X-axis is log MVA: each gridline is ×10 fewer listeners needed. Artist take per rung: pool rows — the per-stream rate itself; Twitch mechanics — 50% split; direct · 360 — 0.80 × 0.70 = 0.56; direct breakeven/k=4 — 0.80; direct recurring TON — 0.949. Changing the division rule moves MVA ~×1.3; changing the mechanism moves it 1–2 orders of magnitude (188,590 → 900 at recurring k=12 — decomposed: k 4→12 gives ×3.0 to 1,068 at the same 0.80 take, the TON rail 0.80→0.949 gives the last ×1.19 to 900).
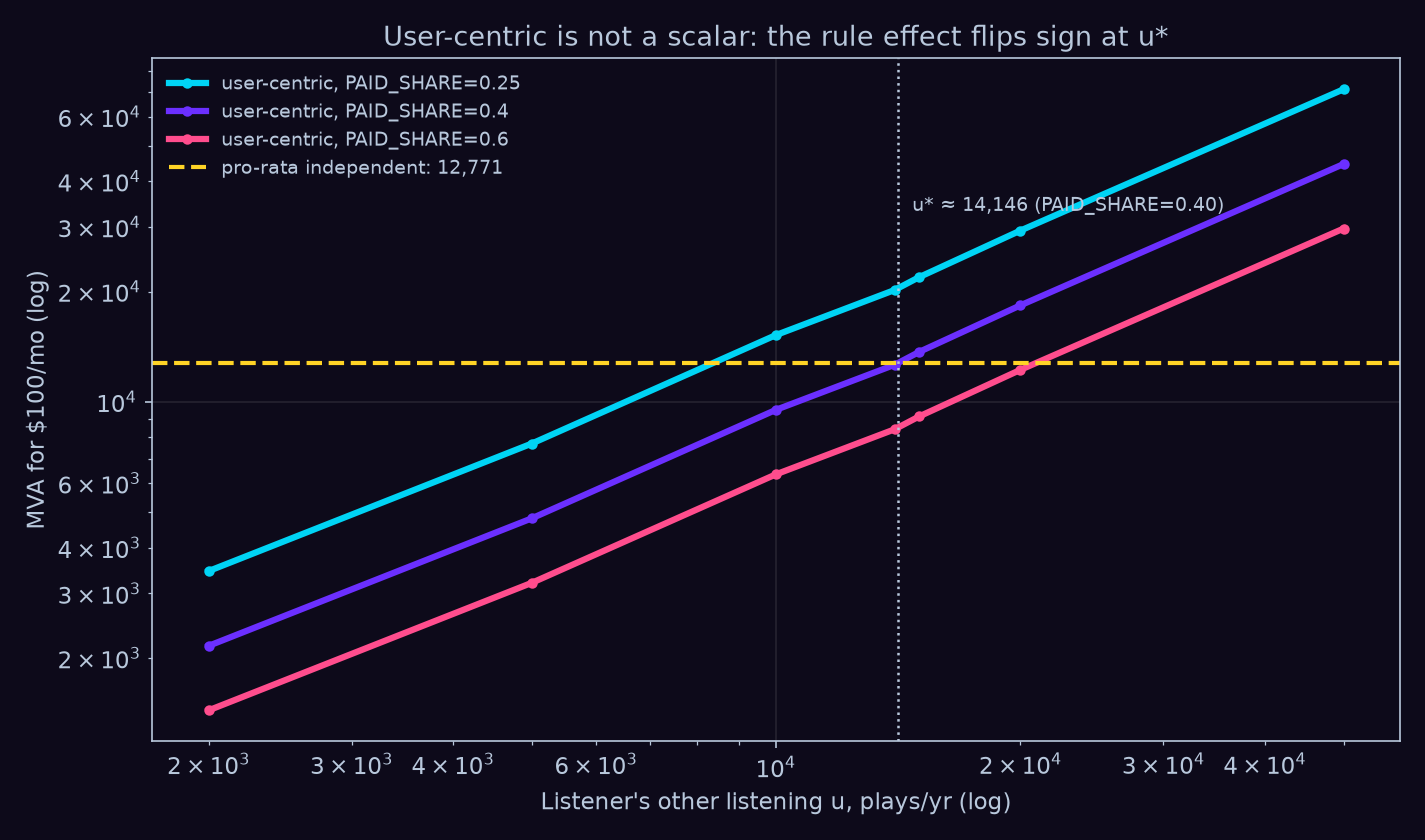
fig14 — user-centric is not a scalar (Monte-Carlo wallet model, 200,000 listeners/point, seed 42; log-log). MVA under user-centric as a function of the listener’s other listening u, for three PAID_SHARE values; the yellow dashed line is pro-rata independent (12,771). Each curve crosses it at its indifference point u* (14,146 at the baseline PAID_SHARE 0.40): above u*, the rule reform makes this artist’s audience worse off.
Finding 2 — breakeven is a range, not a point. Direct donations beat the independent streaming pool when a devoted fan pays more often than 0.38–1.25–6.31 times/year (min/median/max over 18 axis combinations; the earlier point estimate was retracted — see Retracted & bounded). Recurring patronage closes the range structurally: Twitch/Patreon paying-fan cadence is 12/yr against the worst corner of 6.31, and recurring k=12 on the TON rail drops direct MVA to 900. The Twitch-mechanics rung (2,353) uses Twitch’s own fixed $5 subscription; on the same $6.89 mean ticket as the direct rows it would be 1,709 — the direct economy’s edge over the Twitch mechanics is the take rate (5% vs a 50% split), not the rail (CRITIC §1; RESULTS v0.3 §1–§2; PAPER §4; sim1 SPEC §3.4).
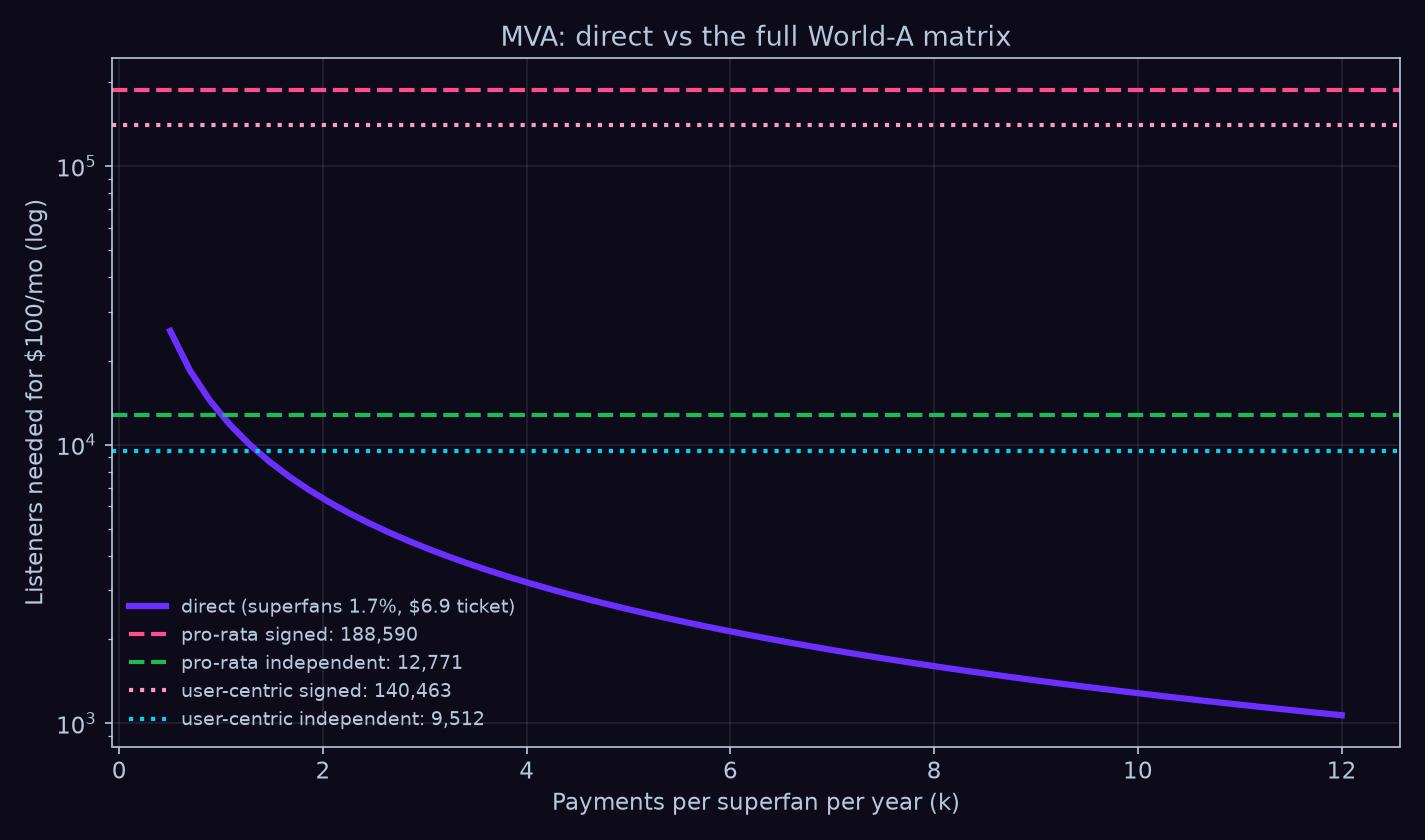
fig1 — MVA versus payment rate k (analytic curves; the user-centric reference lines carry the Monte-Carlo wallet estimate). MVA = minimum viable audience for $100/month; k = payments per superfan per year; y-axis is log. The purple direct curve crossing below the green independent-pool line near k≈1 is the breakeven of Finding 2; each further doubling of k halves the required audience.
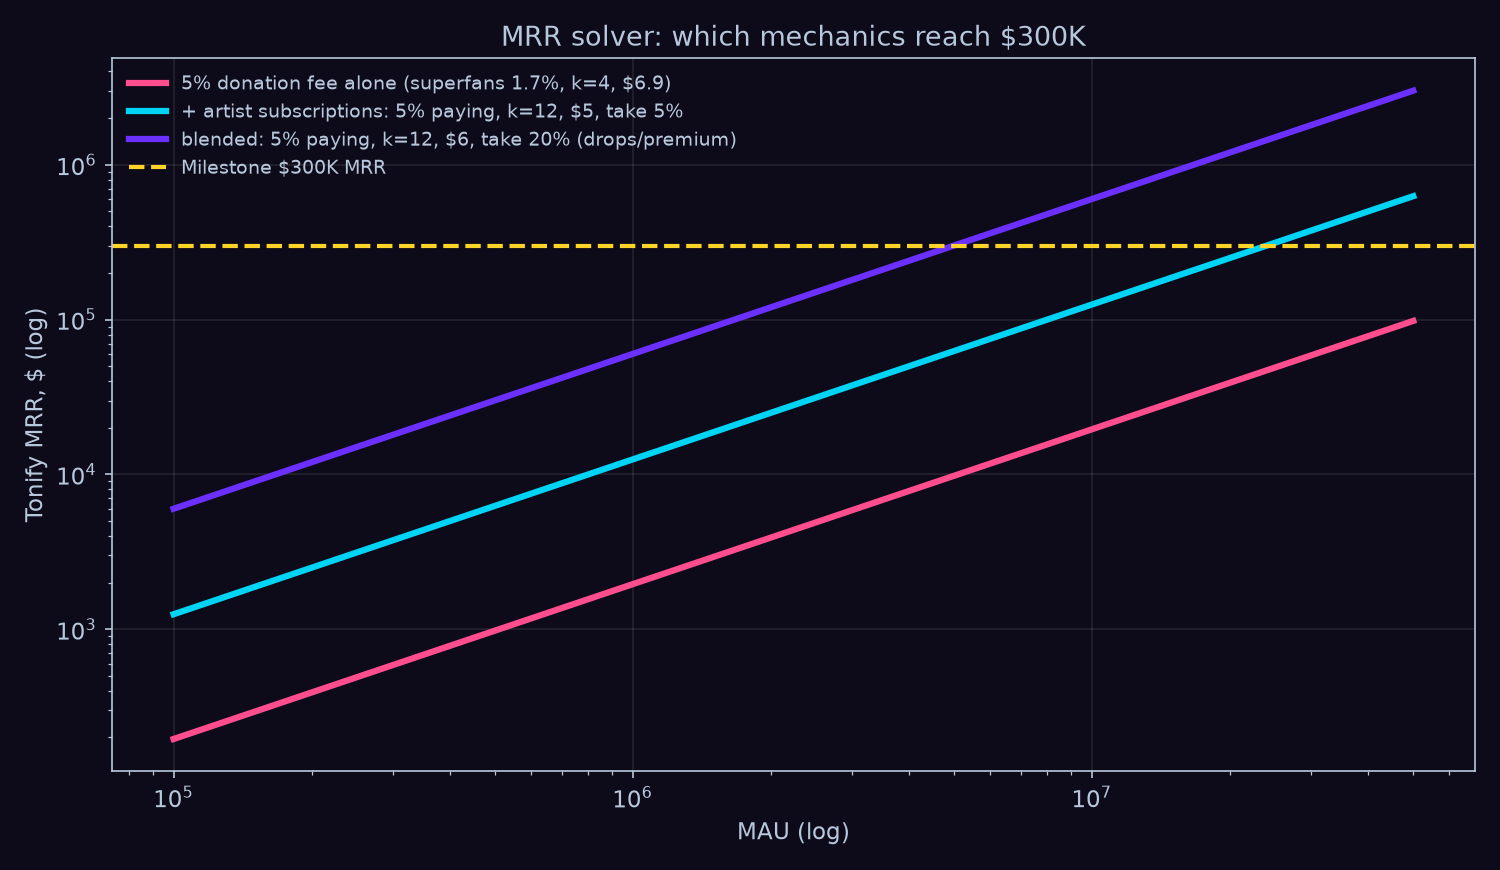
fig6 — the $300K MRR solver (analytic curves; log-log axes). MRR = the platform’s monthly recurring revenue; MAU = monthly active users. A lone 5% donation fee yields $1,955 MRR at 1M MAU — a 150× gap to the milestone; the milestone closes only with recurring patronage and blended take 15–20% at 5–10M MAU.
Finding 3 — fraud dilutes pools, not direct rails. Injecting F% bot streams drains F/(1+F) of the pool from every artist — at 30% injection the pool loses 23% — while honest-artist losses in the direct economy are ~0: a bot cannot donate other people’s money. This is an analytic dilution curve with zero detection assumed, not a simulation; the direct economy has its own loss classes (chargebacks), but they do not spread onto the innocent (RESULTS “Fraud”; PAPER §4; caveat CRITIC §4).
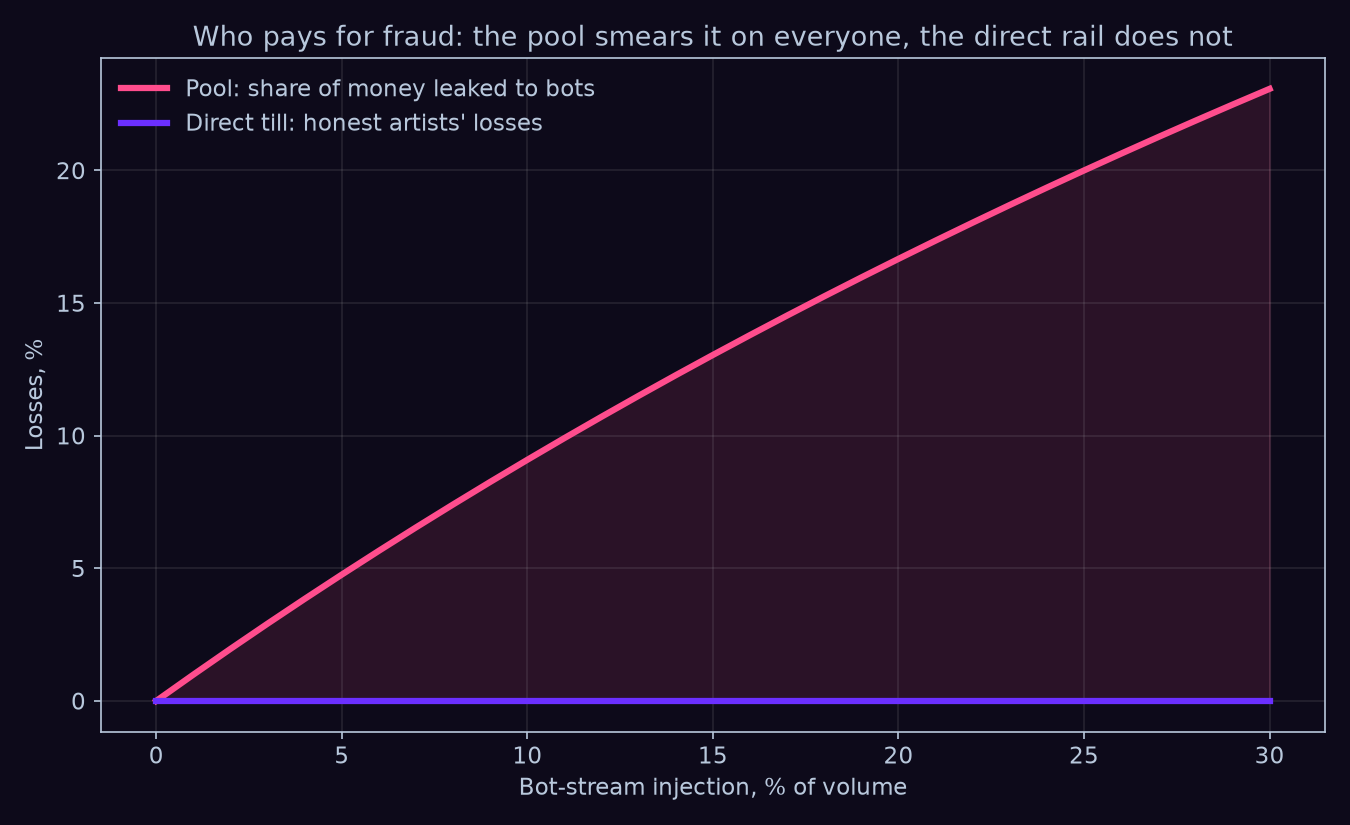
fig3 — pool dilution under bot-stream injection (analytic curve F/(1+F), no simulation, zero detection assumed): the pool’s loss grows toward 23% at 30% injection; the direct rail’s honest-loss curve is flat zero.
Finding 4 — the $13 payout threshold is a decade for signed artists. At Telegram’s $13 minimum withdrawal, 94.3% of signed-pool artists wait longer than a year for their first payout, 89.9% longer than ten years; on the direct rail the mean donation is $6.9 against the same $13 threshold. Of $1 on the TON rail, 94.9¢ reaches the artist (5.0¢ platform, 0.1¢ rail) versus 64.1¢ on Stars mobile (RESULTS “Payout threshold logistics” + §3; PAPER §4).
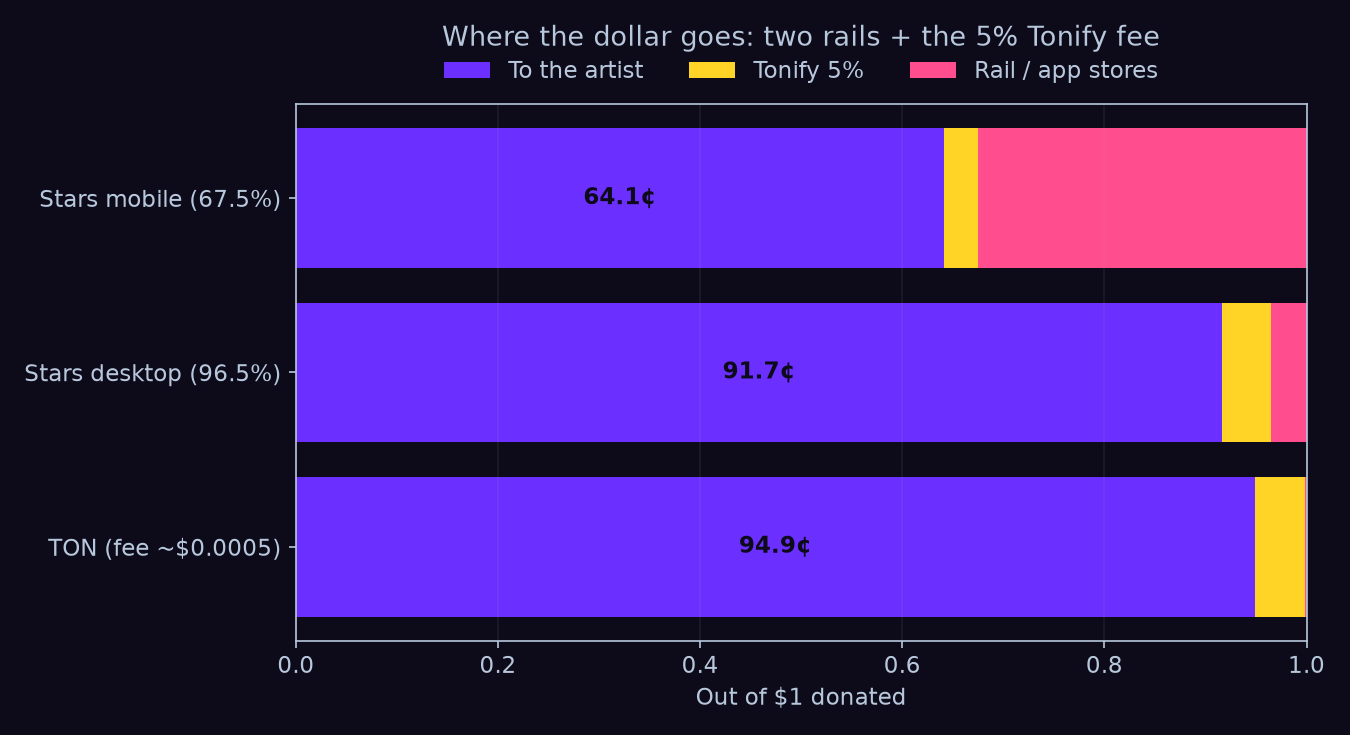
fig4 — where $1 of a donation goes (arithmetic fee breakdown, no simulation): TON rail 94.9¢ to the artist / 5.0¢ platform / 0.1¢ rail, against Stars desktop 91.7¢ and Stars mobile 64.1¢ (32.5¢ to app stores and spread).
sim2 — how music spreads: complex contagion on a synthetic Telegram-like graph
A 50,000-node Barabási–Albert graph with 3,460 planted overlapping chat-cliques (a model, not Telegram data). Adoption is complex contagion: a track converts a listener only after k=2 distinct adopted neighbours. Full protocol and validation: sim2 README, sim2 SPEC.
Finding 5 — seeding hubs beats random seeding, on a model. Top-hub seeding beats random at every budget B ∈ [2; 500] at p = p* = 0.15 (B=5: 4,509 vs 0 reach-per-seed; B=500: 55.4 vs 46.5), and the verdict survives a pure-BA-hub control (B=1 is structurally degenerate for complex contagion and excluded). Chats change the reliability of complex contagion, not its possibility: P_macro = 1.00 / 0.15 / 1.00 (simple on bare BA / complex on bare BA / complex with chats) (sim2/README; falsifier verdict SPEC §6; experiment C).
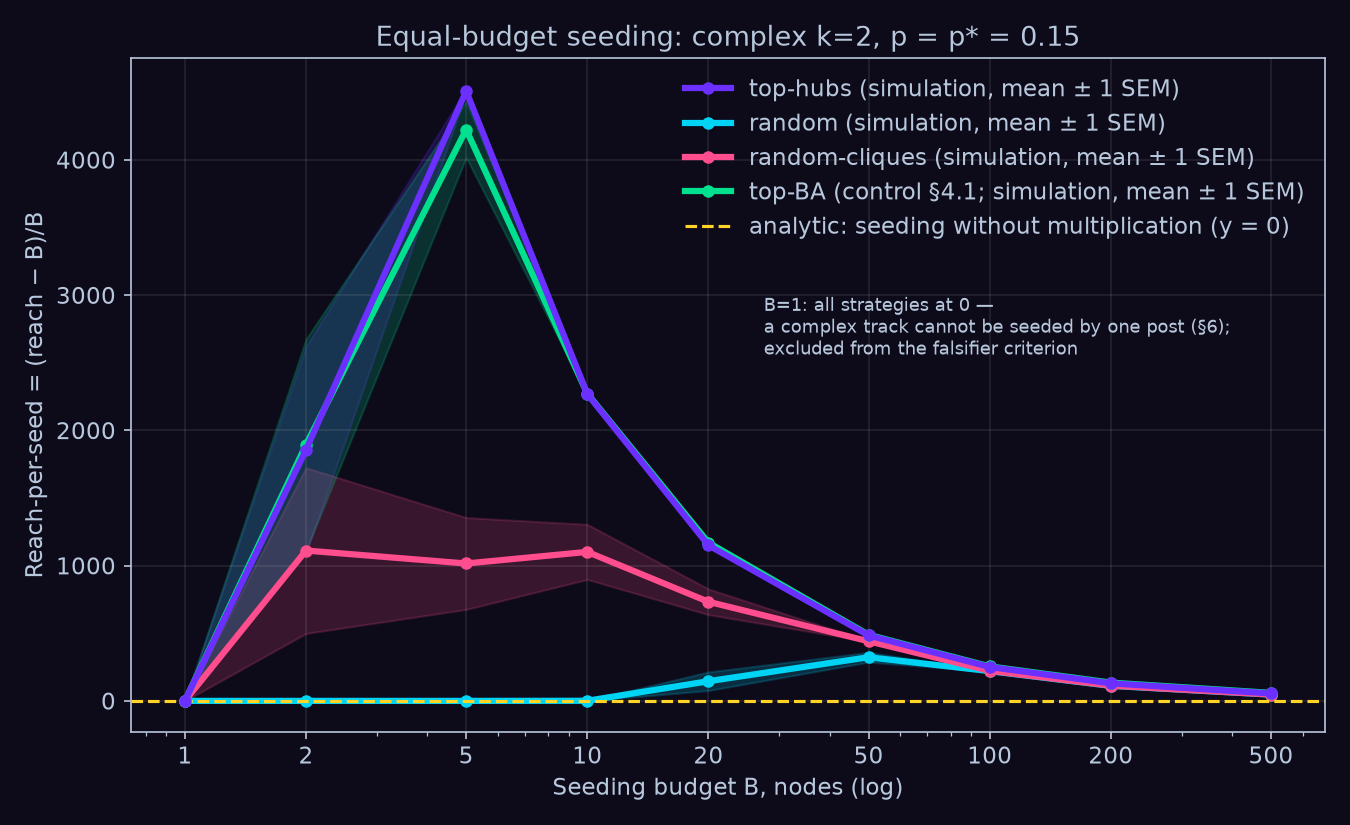
fig8 — reach-per-seed by seeding strategy (simulation, 30 runs/point, mean ± 1 SEM; log x-axis of seeding budget B). Reach-per-seed = (adopters − B)/B, i.e. organic adoptions per seeded node; the yellow y=0 line is “seeding without multiplication”.
Finding 6 — the hub advantage is a small-budget effect. The hub-vs-random gap is not a constant premium: at B=5 it is the difference between a cascade and none (4,509 vs 0 reach-per-seed — random seeds simply fail to ignite complex contagion), while at B=500 it compresses to +19% (55.4 vs 46.5 — the converging tails on fig8). Strategy is decisive exactly when the seeding budget is small; at B ≤ 20 part of the hub win is seed density in general, and the clean hub effect (+14–19%, up to +27.7% for the top-BA control) isolates at B ≥ 100 (experiment A; sim2/README §4.1 v1.3).
Finding 7 — the model’s critical point is the product’s K-factor. R_eff — adoptions caused per adoption — crosses 1.0 between p = 0.15 and p = 0.20 (0.891 → 1.354 at k=2): below that per-exposure conversion a seeded track dies out; above it macro-cascades become near-certain (P_macro 0.500 → 0.775). The model knob p (“a neighbour’s adoption converts me”) is, in product terms, the viral K-factor of a share — so the phase boundary at p* = 0.15 is a measurable product target, not a simulation abstraction: an MVP that lifts per-exposure conversion past ~0.15–0.20 carries the product across the cascade threshold (experiment B; fig9).
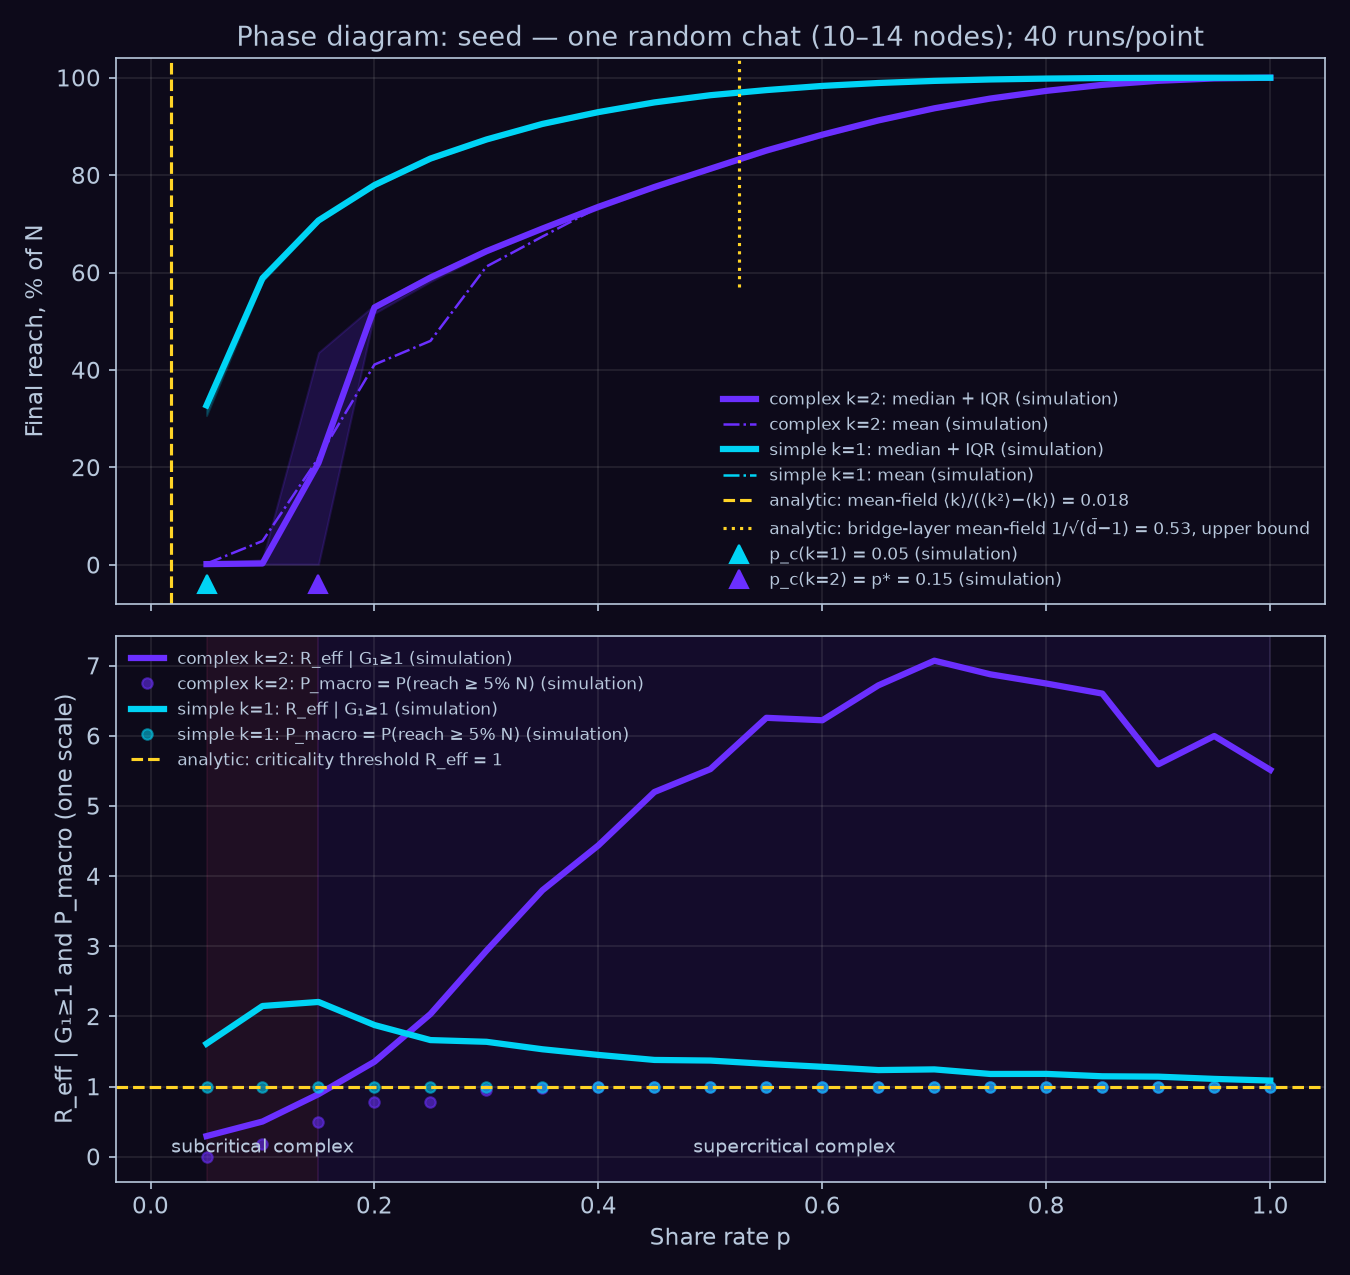
fig9 — the phase diagram (simulation, 40 runs/point) with analytic references: complex-contagion critical point p = 0.15 (grid precision) against the simple-contagion mean-field 0.018 and the chat-layer upper bound 0.53. P_macro = probability of reaching ≥5% of the graph; R_eff crossing 1.0 between p=0.15 and p=0.20 is the K-factor threshold of Finding 7.*
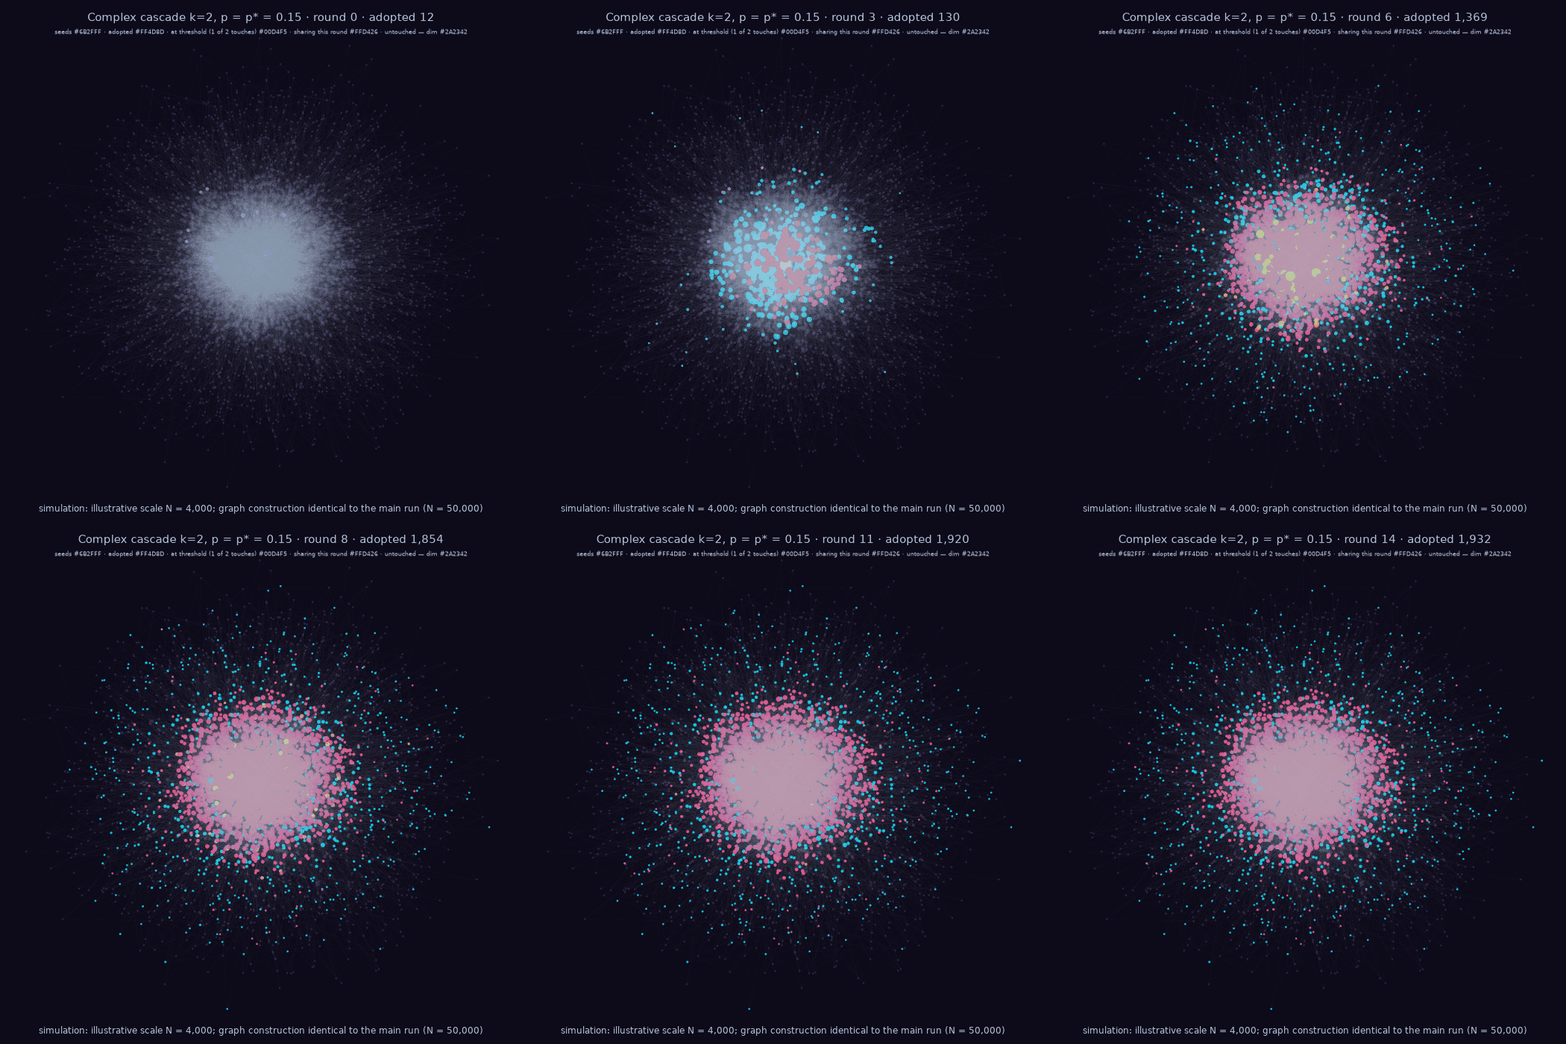
fig10 — one complex-contagion cascade spreading through chat cliques (simulation, a single cascade on a 4,000-node illustrative subgraph, 48.3% reach, seeded from a single chat). Inline above is the full animation; direct file: fig10_cascade.gif (2.6 MB, 15 frames, round 0 → 14).
sim3 — treasury survival: the “payouts ≤ inflow” law vs emission
Regime A pays artists only from real inflow (the Tonify treasury law); regime B pays from token emission (the STEPN/Axie class), calibrated to be consistent with Hamster Kombat’s ×25 collapse in 6 months. 200 Monte-Carlo runs; an artist layer of 10,000 agents. Full hierarchy of results and falsifiers: sim3 README, sim3 SPEC.
Finding 8 — emission economies collapse in-model; the law cannot bankrupt its treasury. The law-bound treasury has zero invariant violations across all runs (a structural property), while the emission regime loses ≥80% of peak DAU in 200/200 Monte-Carlo runs — invariant across all red-team stress forms; the sharper statistics hold only under the baseline price form: median death month t* = 12 [IQR 11–13], and the token-denominated treasury “dies” ~6 months before the product (a denomination defect — the same treasury marked in $ at collection grows monotonically, 0/200 deaths). The emission regime’s payout/inflow ratio crosses 1.0 in month 3 and peaks at 36.9 (it pays out 37× what it collects) against a structural 0.50 for the law-bound regime — which is still no immortality: net churn c − i ≥ 8.55%/month kills the law-bound product too, by external causes (sim3/README §7 v1.2; falsifier SPEC §8; calibration: Hamster Kombat ×25/6 mo).
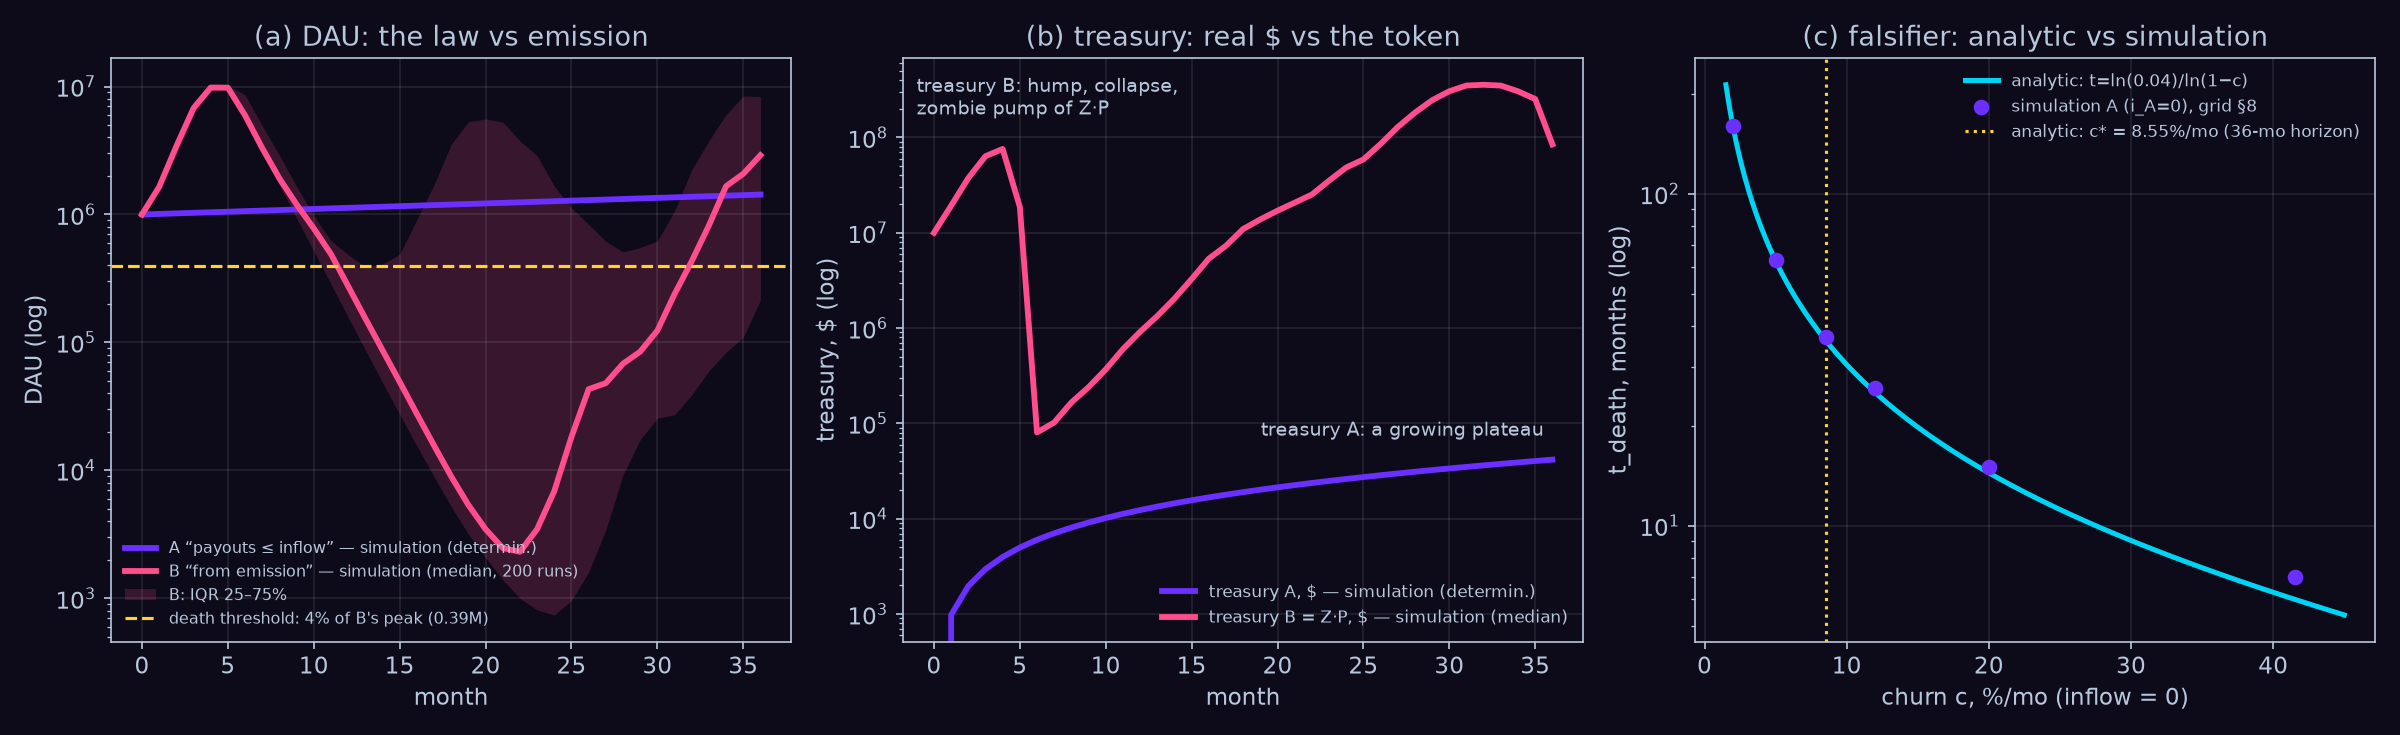
fig11 — DAU and treasuries (simulation: regime A deterministic, regime B median of 200 runs; log y-axes; IQR = middle-50% band): the law-bound treasury plateaus at $41,700 with zero deaths while the emission treasury collapses ×943 from its $75.8M peak; right panel — the falsifier: net churn ≥ 8.55%/month kills the law-bound product too (analytic curve, simulation dots).
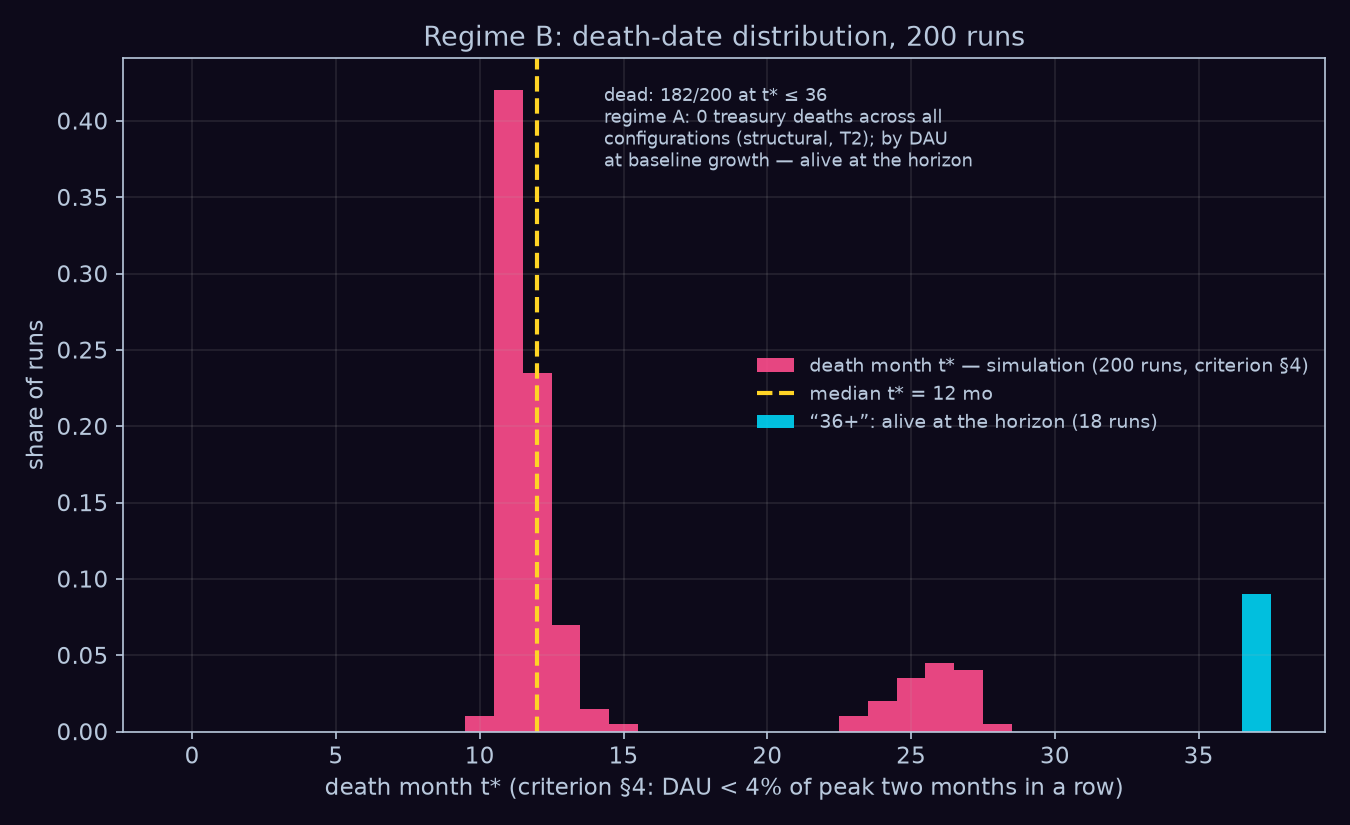
fig12 — distribution of the emission regime’s death month (simulation, 200 runs; median t = 12, IQR 11–13, baseline price form); the “36+” column is the 18 zombie runs cycling at 4–7% of peak.*
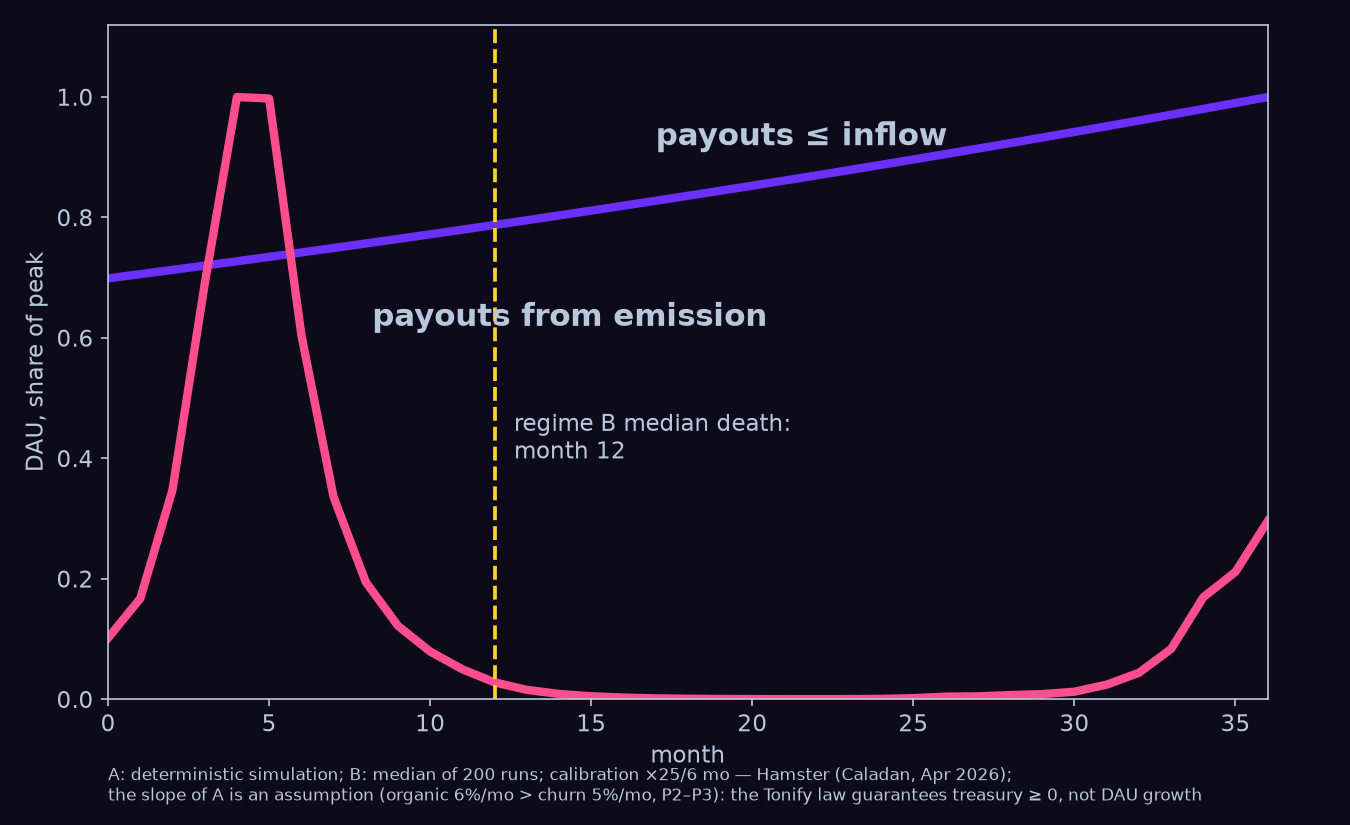
fig13 — the two-curves slide (simulation: A deterministic, B median of 200 runs; DAU as a share of each regime’s peak): the direct-economy treasury versus the emission treasury on one axis, with the emission regime’s median death month marked.
Finding 9 — platform indifference: the artist’s contract barely moves the platform’s treasury. Switching the artist layer from independent to signed-360 cuts aggregate artist income by ~1/3 (regime A: $51,898 → $36,171/month at t=36) — but moves the platform treasury by −0.19% ($41,700 → $41,623). The platform is financially near-indifferent to the contract its artists are on: platform revenue scales with flow, artist survival with the artist’s share of it — the party with the least skin in the contract game holds the pen. The incentive asymmetry is structural, not moral (sim3 artist layer, §6, both contract columns).
Finding 10 — artist churn is the norm in both regimes. 9,010 of 10,000 artists exit within 36 months even in regime A (990 survive; regime B median: 950 survive — and regime B’s artist incomes are paper emission, not external money). The treasury law keeps the platform alive; it does not keep the median artist alive — individual survival is set by audience size against the exit threshold, which is sim1’s MVA problem, not sim3’s treasury problem. The catalogue survives through its weight coefficient (w₃₆ = 0.989): the platform lives on a long tail of small artists who individually churn. An honest number to lead with, not to bury (sim3 artist layer, §6).
Reproducibility
python3 run_all.py # all three simulations + 14 figures x EN/RU -> ./figures + ./figures/ru, ~1-2 min, exit 0
- Deterministic: seed=42 everywhere; a re-run produces byte-identical stdout across environments; figures are byte-identical within one environment (matplotlib version and fonts affect PNG hashes).
- Validation before conclusions: every simulation prints its validation gates (target → obtained → tolerance → PASS/FAIL) before its results; a FAIL blocks the conclusions with a non-zero exit (sim1 gates: sim1 SPEC §5).
- Dependencies: python3, numpy, matplotlib; scipy + networkx (sim2); pillow (gif). No API keys, no data downloads — the world is synthetic and self-contained.
- Individually:
python3 sim1/tonify_cash_sim.py(thensim1/v04_full.py,sim1/v05_matrix.py,sim1/v06_uc_crossover.py),python3 sim2/tonify_graph_sim.py(~36 s),python3 sim3/sim3_anti_graveyard.py(~1 s). - Provenance: every model parameter → value used → source → vault note in SOURCES.
Repository layout
tonify-sims/
├── run_all.py        # one command: sim1 + sim2 + sim3, figures fig1-fig13
├── README.md         # this file (EN, primary) · README.ru.md — Russian, full parity
├── SOURCES.md        # every parameter -> value -> source -> vault note (EN · SOURCES.ru.md)
├── paper/            # sim1 documents, EN primary + Russian originals:
│                     #   PAPER.md / PAPER.ru.md (model; the RU original is the source of truth),
│                     #   RESULTS.md / RESULTS.ru.md (numbers),
│                     #   CRITIC.md / CRITIC.ru.md (red team, retractions)
├── sim1/             # cash register vs pool: SPEC.md v1.1 (model equations,
│                     #   parameter classes, gates), tonify_cash_sim.py,
│                     #   v04_full.py, v05_matrix.py, v06_uc_crossover.py
├── sim2/             # music spread on a synthetic Telegram-like graph:
│                     #   tonify_graph_sim.py, SPEC.md v1.3, README.md
├── sim3/             # anti-graveyard treasury law vs emission:
│                     #   sim3_anti_graveyard.py, SPEC.md v1.2, README.md
├── figures/          # fig1-fig14 (EN) · figures/ru/ — the same 14 in Russian,
│                     #   both regenerated by run_all.py
└── LICENSE           # MIT
The sim2/sim3 SPECs and the per-sim READMEs are process documentation in Russian — spec revisions, red-team CHANGELOGs, validation protocols. This README is self-contained: every headline number above appears here with its source, and the figures carry the rest.
Retracted & bounded
Each simulation went through a red team with the right to retract numbers. This section is what that right produced. Genre and full text: sim1 — CRITIC; sim2/sim3 — CHANGELOG blocks in sim2 SPEC and sim3 SPEC.
sim1 (CRITIC.md, verdict format: accusation → verdict → action).
- Retracted: the “status quo = 0.42 donations/superfan/yr” headline — built on SoundCloud’s 29% superfan revenue share, which is a share of royalties under fan-powered payouts, not of donations. A category error; the number was removed from the results (CRITIC §1). At that retracted frequency the direct economy honestly loses to the independent pool (MVA 30,782 vs 12,771).
- Retracted (v0.5.1): the Addendum’s user-centric-signed MVA of 140,095 — a draft-run artifact not reproducible by the code and internally inconsistent with its sibling 188,590; replaced by 140,463, with the label pass-through now derived from the two anchors (0.0003/0.00443 = 6.772%) instead of entered as a rounded 0.068 (PAPER CHANGELOG v0.5.1).
- Point → range: breakeven became 0.38–1.25–6.31 donations/yr across 18 combinations of three axes, each replaced after attack: plays/listener 21.2 → 8–21 (LFM-1b measures panel lifetime, not a year; the error direction is against the direct economy), donation check $5 → $3.1–6.9 (the only music-specific PWYW experiment: mean €3.10 and a rising refusal share, 24.4% vs 17.3%), superfan share 1.7% → 0.6–1.7% (the 90-9-1 rule measures as 97-2-1) (CRITIC §2, §6, §7).
- Fixed: deterministic fractional superfans → binomial sampling — an artist with 30 listeners now has an honest ~60% chance of zero direct income (CRITIC §3). Bounded: Spotify’s “>$1000/yr” is rightsholder royalties, so pool-vs-direct comparisons are valid only in the independent regime (artist = rightsholder) (CRITIC §5).
sim2 (SPEC CHANGELOG v1.0 → v1.3). Two honest construction stops, admitted and resolved by spec revision, not by tuning to the result: v1.0’s independent clique placement blocked complex contagion entirely (p* did not exist — the designed stop fired), and v1.1’s T3(b) threshold was a metric/threshold category error. v1.2’s T3 thresholds were fixed after diagnostic runs — admitted as post-hoc in the CHANGELOG, with the PASS reproduced on independent seed batches (P_macro = 0.150/0.075/0.125, all under the 0.25 bar) and a standing process rule added: thresholds are fixed before diagnostic runs, or the deviation is declared. The v1.3 audit also quantified hub-definition contamination (81.6% of top-500 union-hub degree is clique edges) and added a pure-BA control — which showed the union definition had understated the channel advantage, not created it. Audit verdict: accept; no numbers retracted.
sim3 (SPEC CHANGELOG v1.1, v1.2).
- Target retracted as structurally unachievable: the original T3a demanded 200/200 strict deaths; the implementation proved a “phoenix” rebound is a property of the price equations (the buy/sell ratio in the zombie phase does not depend on price), so no calibration point yields 200/200. The target was reformulated with externally justified thresholds (80% loss = business-case death, more conservative than the Hamster −96% and GST −99% anchors); mechanics untouched (v1.1).
- Unconditional numbers retracted to qualified: “182/200 strict deaths, median t* = 12” now carries the mandatory qualifier under the baseline price form — red-team sensitivity: 148–190/200 across κ ∈ [0.35; 0.65], and 0/200 strict under a linear price form with moderate response, while the ≥80%-loss flagship stays 200/200 in every variant (v1.2). The claim “T1 reproduces Hamster ×25/6 mo” was weakened to “consistent with”: the collapse-factor scale is semi-circular (the crash-rate clip derives from the same anchor); what is emergent is the peak timing and the endogenous path (v1.2).
- Bounded: everything after the first collapse breach is a phoenix artifact, not a forecast — the post-collapse phase is uncalibrated and diverges from both anchors (real projects sit on the floor; 96/200 model runs re-peak); sim3’s conclusions are built on events up to and at the collapse (§11.11).
External review (v1.1)
An external reviewer took seven shots at sim1; all seven landed, one landed harder than written. Same genre as Retracted & bounded — what was claimed, what the verdict was, what changed (sim1 SPEC CHANGELOG v1.1):
- “×14.8 is input inversion, the matrix is rank one.” Correct: the contract axis is one measured pass-through applied to both rows, so ×14.8 = 1/0.06772 by construction. Reworded everywhere — arithmetic, not emergent; the matrix’s contribution is commensurability.
- “The UC scalar hides the dependence on wallet size” — and worse than written: the effect flips sign. At u=20k user-centric needs 18,341 listeners against pro-rata’s 12,771. The scalar ×1.34 is replaced by the crossover u* (fig14, v06): 8,731 / 14,146 / 21,371 plays/yr at PAID_SHARE 0.25 / 0.40 / 0.60. This turns sim1’s headline weakness into its one real finding: rule reform has an indifference point and works in opposite directions on either side of it.
- “The hero paragraph leads with the best corner of two retracted ranges.” Correct; the hero now leads with the full corner range 3,204…20,161 and names that the worst corner loses to the independent pool. A standing communication rule was added to Process.
- “Twitch benchmark uses a different ticket.” Correct: 2,353 is at Twitch’s fixed $5; on the aligned $6.89 ticket it is 1,709 — the edge is the take rate (5% vs 50%), not the rail.
- “3,204 → 900 silently mixes cadence and rail.” Correct; decomposed: cadence k 4→12 gives ×3.0 (to 1,068 at the same take), the TON rail gives ×1.19 (to 900); per-rung takes are now in the fig5 caption.
- “sim1 has no validation gates; T3 misses by 11% unflagged.” Correct; sim1/SPEC.md now exists (the only simulation without one — the root of all seven findings), gates print target → obtained → tolerance → PASS/FAIL and a FAIL exits non-zero; the T3 tolerance [40%; 55%] is declared post-hoc with its inter-source justification (Celma 50% vs CMA 63–65%).
- “Byte-identical figures” overclaimed. Correct; scoped to one environment (stdout stays byte-identical across environments).
Limitations, first-class
This is a calibrated calculator, not data. It aims, the MVP measures.
- The decisive axes are unmeasured. Donation frequency, check size and superfan share — the three axes of the breakeven range — are exactly the quantities no dataset provides for music; the simulations name the dials, the MVP is designed to measure them. Adjacent-industry cadence benchmarks (Twitch, Patreon, Tencent) substitute for them; the Tencent benchmark is blended with advertising, and gifting carries regulatory risk (−66% segment revenue for TME over 3 years) that the model does not price (PAPER §9).
- sim1: the world is synthetic and the donation form is assumed. The 200,000-artist market is a piecewise construction between three measured anchors (validated: 87.0% / 2.6% / 44.5%, Gini 0.97), but the tail shape between anchors is a construction; the donation-check distribution (lognormal, Bandcamp/Twitch shape) is an assumption, not a music measurement; user-centric is a wallet-share approximation, not a full bipartite graph.
- sim2 is a model, not Telegram data. The graph is synthetic (BA + planted overlapping cliques); Telegram publishes no private-group statistics, so chat sizes, 50% coverage and bridge-layer density are assumptions or constructions — the chat-layer critical estimate transfers to reality only up to that density. No forgetting, no unsubscribes, no competing cascades: reach is an upper bound.
- sim3’s calibration is a composite. One calibration anchor for the collapse shape (Hamster Kombat ×25/6 mo) plus two unverified stylized facts (STEPN entry economics, Axie); the emission regime reproduces a class of collapses, not any single project. The token price is a stylized form, not market microstructure — the strict death statistics (182/200, t* = 12) are a property of the baseline price form; only the ≥80%-loss result is form-invariant.
- The simulations are deliberately isolated. sim1 has no social dynamics, sim2 spreads one track in a vacuum with no churn, sim3 has no network effects between users and no competitors or external shocks; cross-sim coupling (does distribution reach convert to donations?) is out of scope.
Related work
- Attribution and provenance (the upper half of the pipe). Teikari (2026), Governing Generative Music: Attribution Limits, Platform Incentives, and the Future of Creator Income (SSRN 6109087), with companion code music-attribution-scaffold, builds the attribution/provenance infrastructure — who should be credited and under what confidence. This repository is the lower half: how the money physically moves once you know who to pay — pool division versus direct payment mechanics, their fraud surfaces, and treasury survival.
- Payout-rule theory. Bergantiños & Moreno-Ternero (2023), Revenue sharing at music streaming platforms (arXiv:2310.11861), give the axiomatic foundations for pro-rata and user-centric division; their core theorem (any stable rule divides a listener’s fee only among artists that listener streamed) is the reason World-A ceilings in sim1 are set by an artist’s own audience under any formula (PAPER §1).
- Independent convergence, three authors in three years (a timestamp, not a claim of coordination): Burk (2023, Cheap Creativity and What It Will Do, 57 Georgia Law Review 1669) argues cheap machine creativity shifts intellectual property toward regimes that certify authenticity rather than incentivize production → Teikari (2026) builds the attribution/provenance layer that does the certifying → this work (2026) models the payment mechanics that run on top once attribution is settled.
Process
Each simulation went through an economist → engineer → red team → viz → acceptance cycle, with the red team holding the right to retract numbers. The project hit three honest construction stops (sim2 v1.0: p* did not exist by construction; sim2 v1.1: the T3(b) metric/threshold category error; sim3: target T3a structurally unachievable because of the phoenix rebound) — each resolved by spec revision with a CHANGELOG and externally justified thresholds, none by tuning to the result (verified by the red team on independent seed batches). Retracted numbers are listed in CRITIC (sim1) and the SPEC CHANGELOG blocks (sim1 SPEC, sim2 SPEC, sim3 SPEC). Standing communication rule (external review v1.1): once a point estimate is retracted into a range, headline text leads with the middle or the full range — never with an edge.
License
MIT — see LICENSE. To cite this repository, see CITATION.cff.